HOME > SERVICES> SERVICE> Numerical analysis in VGA signal transmission
Numerical analysis in VGA signal transmission
2007-12-25
VGA signals have different pixel point clocks or equivalent analog broadband based on different resolutions and field frequencies (refresh rates), as shown in the table below:
Resolution | Refresh Rate | Horizontal Frequency | Pixel Frequency |
640×480 | 60Hz | 31.5 kHz | 25.175 MHz |
72 Hz | 37.9 kHz | 31.500 MHz | |
75 Hz | 37.5 kHz | 31.500 MHz | |
85 Hz | 43.3 kHz | 36.000 MHz | |
800×600 | 56 Hz | 35.1 kHz | 36.000 MHz |
60Hz | 37.9 kHz | 40.000 MHz | |
72 Hz | 48.1 kHz | 50.000 MHz | |
75 Hz | 46.9 kHz | 49.500 MHz | |
85 Hz | 53.7 kHz | 56.250 MHz | |
1024×768 | 43Hz Interlaced | 35.5 kHz | 44.900 MHz |
60 Hz | 48.4 kHz | 65.000 MHz | |
70 Hz | 56.5 kHz | 75.000 MHz | |
75 Hz | 60.0 kHz | 78.750 MHz | |
85 Hz | 68.7 kHz | 94.500 MHz | |
1280×1024 | 60 Hz | 64.0 kHz | 108.000 MHz |
75 Hz | 80.0 kHz | 135.000 MHz | |
85 Hz | 91.1 kHz | 157.500 MHz | |
1600×1200 | 60 Hz | 75.0 kHz | 162.000 MHz |
65 Hz | 81.3 kHz | 175.500 MHz | |
70 Hz | 87.5 kHz | 189.000 MHz | |
75 Hz | 93.8 kHz | 202.500 MHz | |
80 Hz | 106.3kHz | 229.500 MHz |
According to theoretical analysis, a square wave is composed of odd harmonics such as 1, 3, 5, etc. If the third harmonic can be guaranteed to pass, about 80% of its information content can be retained. If the fifth harmonic is guaranteed to pass, more than 90% of its information content can be retained. Generally speaking, when converting analog broadband, at least three harmonics should be ensured to pass through. In addition, according to the Nyquist sampling principle, the maximum analog bandwidth in the A/D and D/A processes is 1/2 of the sampling rate. Therefore, when converting the bandwidth from a point (pixel) clock, considering the D/A process, the calculation formula is: point clock x 3/2 (if you want to ensure 5th harmonic, it is point clock x 5/2), for example: 1024 x 768 x 70, the bandwidth is about 100MHz, 1280 x 1024 x 60, the bandwidth is about 150MHz, 1600 x 1280, the bandwidth is about 240MHz. In system analysis and design, the bandwidth of the signal must be considered first.
Due to the wide bandwidth (or spectrum) of VGA signals, they exhibit two characteristics during transmission: amplitude frequency characteristics and group delay characteristics. The impact of these two characteristics on image quality is different, and the solutions are also different.
1、 Amplitude frequency characteristic: In short, it refers to the relationship between different frequency components and amplitude during transmission, as shown in the following figure:

The above figure is a typical transmission curve of a cable. It can be seen that the higher the frequency, the greater the attenuation, that is, the more high-frequency component loss. Usually, the frequency defined as bandwidth when the amplitude attenuation is 3dB, where db=20lg amplitude ratio or 10lg power ratio, 3dB means amplitude ratio of 0.707 and power ratio of 1/2.
In transmission systems, there are not only cables, but also processes such as allocation, switching, and conversion. However, these processes are generally guaranteed by corresponding indicators (only in terms of amplitude frequency characteristics), and the bottleneck of transmission mainly lies in the cable aspect. The amplitude frequency characteristics of typical cables are shown in the table below:
SYV-75-2 | SYV-75-3 | SYV-75-5 | RG59 | RG60 |
20 dB | 16 dB | 10 dB | 8 dB | 0.8 dB |
The above parameters are for 100 meters/100 MHz. Many cables have high nominal indicators, but their actual performance is poor. It is estimated that the indicator parameters are inaccurate, so one should not overly trust the indicators of manufacturers (especially non-standard manufacturers). SYV standard cables are not as good as RG standard cables in terms of tailing and other aspects, which can be referred to in selection. Taking RG59 cable as an example, the following table shows a typical set of parameters:
电容 | 延时 | 直流电阻 | 等效阻抗 |
50PF/m | 4ns/m | 0.02Ω/m | 75Ω±5% |
In terms of amplitude frequency characteristics alone, for a signal of 1024 × 768 × 70, to ensure a bandwidth of 3dB, the transmission distance using RG59 cable without other compensation measures is only about 30-40 meters, and the transmission distance of high-resolution images will be shorter. There is a more practical estimation method to evaluate image quality: the 3dB bandwidth is the theoretical value of image quality. In engineering practice, 6dB attenuation is acceptable, while 9dB attenuation is tolerable. No matter how large, it cannot be tolerated. This is a set of reference data for numerical analysis.
2、 Group delay characteristics: In theory, different frequency components arrive at different times when transmitted in the same medium. This is caused by the distribution parameters of the transmission system. To put it vividly, if a fat person and a thin person run a hundred meters, without any accidents, the thin person will run first. Not to mention that there are many frequency components in VGA signals, for a single waveform, the arrival time of the fundamental and multiple harmonics is different, which will cause delay distortion of the waveform, resulting in "trailing" in image representation. This is very common in engineering, such as having a color block followed by a dashed image from dark to light. The thinner the cable, the longer the distance, and the more obvious the performance.
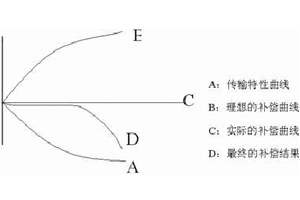
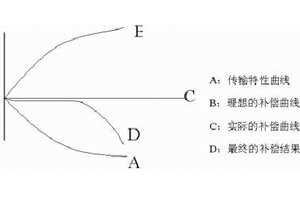
To solve the transmission problem, it is not only necessary to solve the problem of amplitude frequency characteristics, but also to solve the problem of group delay characteristics. Long line drivers are born from this. In terms of amplitude frequency characteristics, the problem to be solved is shown in the following figure:

In terms of amplitude frequency characteristics, taking long-distance drive as an example, after compensation, it can reach 150MHz/100 meters; As for the group delay characteristics, it is necessary to pre adjust the distribution parameters (pre distortion) to eliminate tailing phenomenon. When driving long lines, different compensation adjustments are made in different stages according to the parameters of the cable and transmission distance, such as level 8 or level 16 adjustment. It is worth noting that compensation is for damaged images, which can make them appear without obvious defects in brightness, blurring, and tailing, but still slightly worse than the original signal. When designing a system, it is important to first understand the resolution of the signal, the longest transmission distance, in order to determine which cables to use, which equipment to use, and which interfaces to use. Generally speaking, taking 1024 x 768 resolution as an example, the following choices can be made: (For reference only)
距离(米) | < 20 | < 50 | < 100 | < 200 | < 300 |
方案 | 3+2或3+4 | RG59 RG6V May-75 | Feb-75 Mar-75 + 补偿 | May-75 RG59、RG6V +补偿 | RG59 RG6V +高补偿 |
If the distance is greater than 300 meters, other transmission methods such as fiber optic transmission should be considered. It should be noted that regarding network cable transmission, network cables are much thinner than cables such as 75-2, resulting in poor cable characteristics and significant compensation. Nevertheless, the bandwidth guaranteed is relatively small, generally within 70MHz/100 meters. Therefore, the application range should be around 100 meters. Short term cost considerations may not be cost-effective, and image quality cannot be guaranteed over long distances. The main advantage of this method is that it solves the isolation problem through balanced transmission, rather than improving image quality.
75-2 or finer cables can be soldered into the DB15 connector, while thicker cables can only use BNC connectors. Therefore, cables can be selected based on distance, and the type of interface can be determined accordingly.
Extracted from: InfoAV China
更多案例
- Kedi Intelligent Three Choice for Lhasa Integrated Media Center Launch Station
- Kedi's high-definition and multi format mixed matrix has made a name for itself in the Fuzhou Municipal Party Committee
- Kedi's products have successfully passed the acceptance of the Taishan Nuclear Power Plant project
- Kedi emergency switch stationed at Ningbo Radio and Television Station
- Kedi high-definition multi format matrix for Taipingling Nuclear Power Plant
- Kedi 72 Road 4K60 Matrix for Unicom Tianjin Branch Conference Upgrade and Expansion Project
- Kedi Multi format Matrix Used in Hefei Civil Defense Ground Command Center
- The successful application of Kedi Mixed Moment in the Emergency Command Center of Mianyang Fire Brigade
- Kedi Hybrid Assists the Consultation System of Zhejiang Provincial Department of Natural Resources
- Kedi Multi format Mixed Matrix for Guangdong Provincial Emergency Department


